The Graph API was launched with the promise of being your one-stop shop for everything Microsoft 365 and beyond. While it is yet to live up to that expectation, we cannot deny its importance and some of the benefits it brings to the table. Microsoft is now releasing a set of reporting endpoints, aiming to give customers tools to better understand Graph API usage across their tenant.
This first iteration of the Graph usage reporting API comes with some limitations that you should be aware of. First, it is only available on the /beta endpoint and not currently exposed in any of the admin portals. More impactful is the lack of support for application permissions. In other words the endpoint currently only supports delegate permissions (Reports.Read.All to be more precise), so getting the report data in an automated manner is challenging. Lastly, not every endpoint supported by the Graph API generates usage data currently, and this initial version is limited to data on the following:
- Microsoft Exchange
- Microsoft Teams calling
- Microsoft Teams messaging
- Microsoft Teams presence
Without further ado, here are some examples for working with the Graph usage reporting API. As mentioned above, you will need to run the queries in the context of a user, which in turn needs to have the Global Reader or Global Administrator role assigned. No other roles are currently listed as supported, which is a bit puzzling, considering we have report-specific ones.
The simplest form of query is the one below, which will return data for all applications and services for the last 30 days:
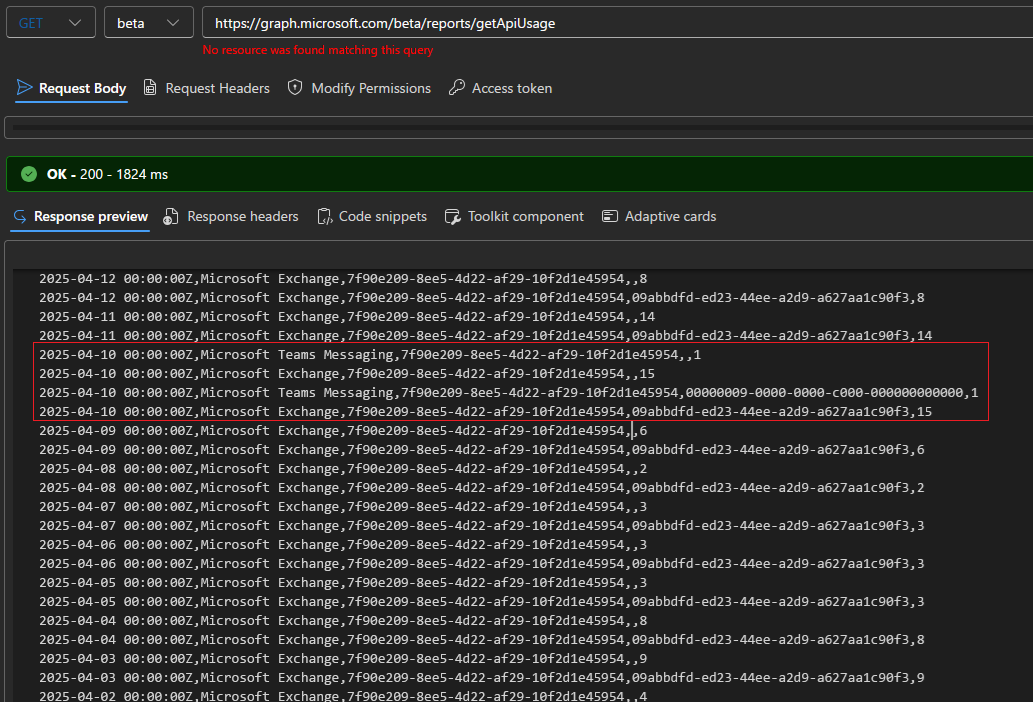
GET https://graph.microsoft.com/beta/reports/getApiUsage

Date,ServiceArea,TenantId,AppId,Usage
2025-04-19 00:00:00Z,Microsoft Exchange,7f90e209-8ee5-4d22-af29-10f2d1e45954,,2
2025-04-19 00:00:00Z,Microsoft Exchange,7f90e209-8ee5-4d22-af29-10f2d1e45954,09abbdfd-ed23-44ee-a2d9-a627aa1c90f3,2
2025-04-18 00:00:00Z,Microsoft Exchange,7f90e209-8ee5-4d22-af29-10f2d1e45954,,7
2025-04-18 00:00:00Z,Microsoft Exchange,7f90e209-8ee5-4d22-af29-10f2d1e45954,09abbdfd-ed23-44ee-a2d9-a627aa1c90f3,7
In contrast to other reporting endpoints, which either return output as downloadable CSV file via redirect or as JSON (select reports only, and still only in /beta), the Graph API usage report returns output directly in text/csv format. You can expect to see one line per day per service per app, as well as a “cumulative” entry per service for each day. The following “columns” are currently returned:
- Date – the date for which the current report entry is, one per day.
- ServiceArea – the service, one of the four listed above.
- TenantId – GUID of the tenant… which only adds noise IMO.
- AppId – GUID for the application, each app should have its own entry per day.
- Usage – count of the API operations performed by a given app for the day.
- ActiveApps – this field is listed in the documentation, but not currently returned. It seems to indicate the count of unique apps with activity for the day and will likely only be available on the “cumulative” entries.
If you want to obtain a more targeted view of the report, you can leverage the set of available optional parameters:
- appId – filter the report by specific AppID value, for example appId=’09abbdfd-ed23-44ee-a2d9-a627aa1c90f3′.
- period – get the report data for specific time period. Unlike other report endpoints, only the following values are currently supported: D7, D30 (default), and D60. For example: period=’D60′.
The date parameter is not supported, so you cannot filter by specific date. - serviceArea – filter the report based on one of the supported service areas, as listed above. For example: serviceArea=’Microsoft Exchange’.
Here are some examples on how to leverage the optional parameters:
#Filter by specific appId
https://graph.microsoft.com/beta/reports/getApiUsage(appId='09abbdfd-ed23-44ee-a2d9-a627aa1c90f3')

#Filter by specific service area
https://graph.microsoft.com/beta/reports/getApiUsage(serviceArea='Microsoft Exchange')

#Extend the report range to 60 days and filter on the service area
https://graph.microsoft.com/beta/reports/getApiUsage(serviceArea='Microsoft Exchange',period='D60')
There are few additional details and oddities that need to be mentioned. First of all, do not be surprised if the report returns no data in your tenant, as the goal is to only cover third-party applications. Microsoft seems to have omitted some first-party apps though, such as the 00000009-0000-0000-c000-000000000000 (Power BI) entry we see above. Or, they might not treat all first-party apps equally, we shall see. For the sake of completeness, here’s how an “empty” report looks like:
Another interesting observation is that the obfuscation option that the Microsoft 365 usage reports support does not affect the output of the Graph API usage report, which is yet one more difference in behavior. Maybe one day we shall see some standardization effort across all Graph endpoints…
One of the possible uses you might have for the Graph API usage report is around the imminent deprecation of EWS. While the report does not cover EWS (or any other API not exposed via the Graph for that matter), you can leverage the report as a way to measure non-first-party Microsoft Exchange usage. The last thing I wanted to mention is that there seems to be some slowness in generating the output, even when zero usage data is returned. Then again, we’ve had even worse experience with some other /beta releases, so waiting few more seconds is hardly a deal breaker.
And that I believe is all I wanted to cover in terms of the newly introduced Graph API usage reports. While limited in scope and with some rough edges, the reports do their job and can give you an insight of the set of (third-party) applications that generate calls to the set of supported Graph endpoints and services. As more services get onboarded to this feature, tenants will finally have a cheap and easy to use method to gauge Graph API usage across their entire tenant. If the level of detail the reports provide do not meet your needs, you can always pay for the Graph API activity logs feature.


1 thought on “First look at the Graph API usage report”